Interaction Maps & Heatmaps Platform
See a complete view of how customers engage
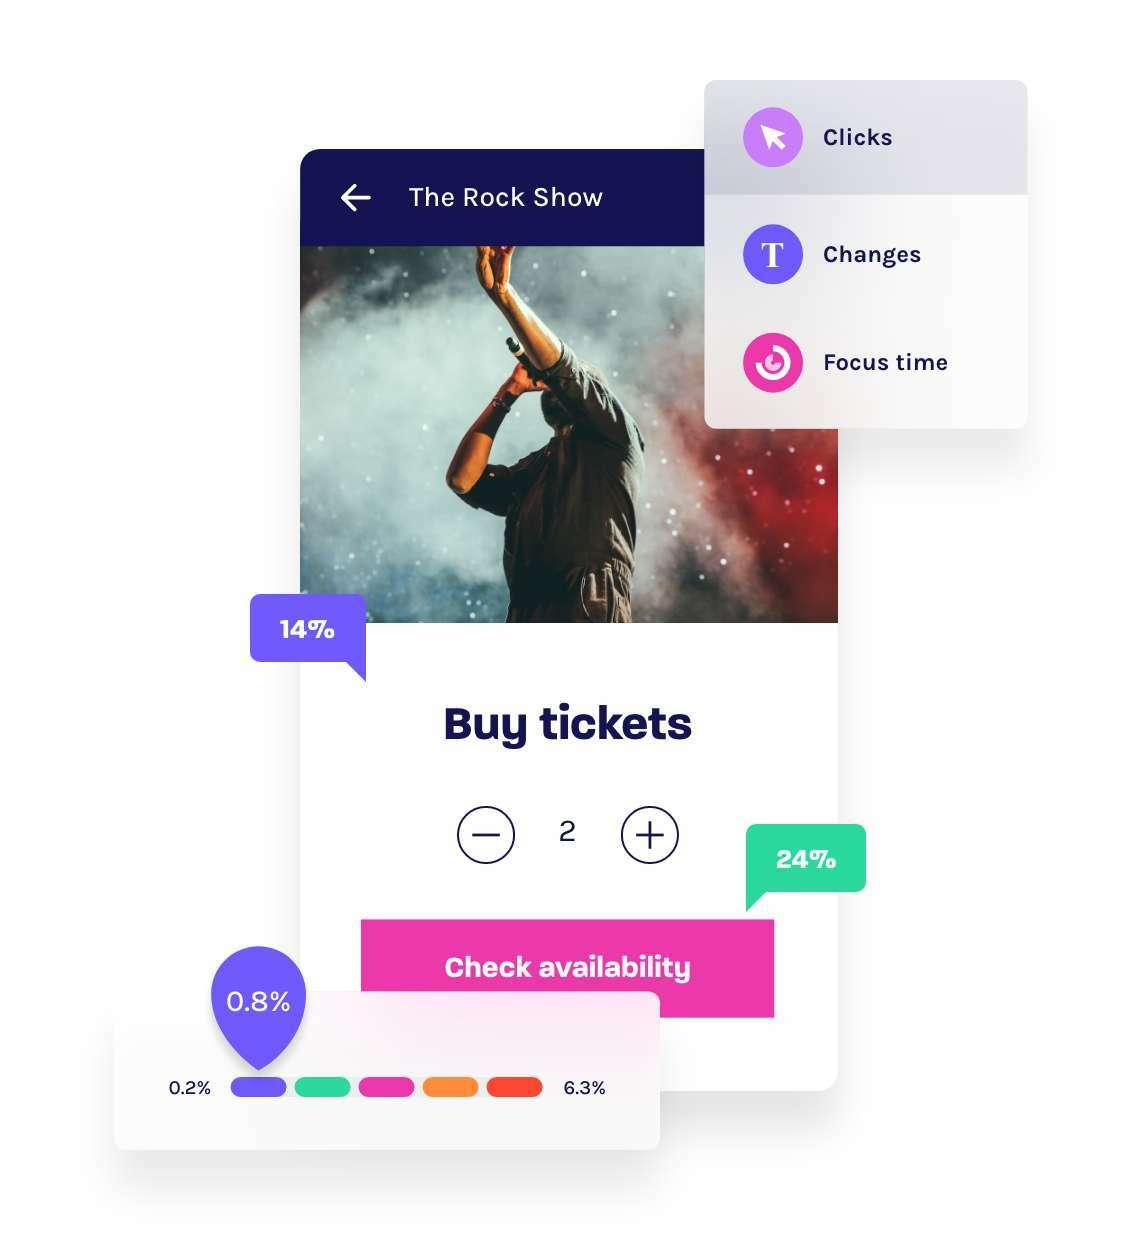
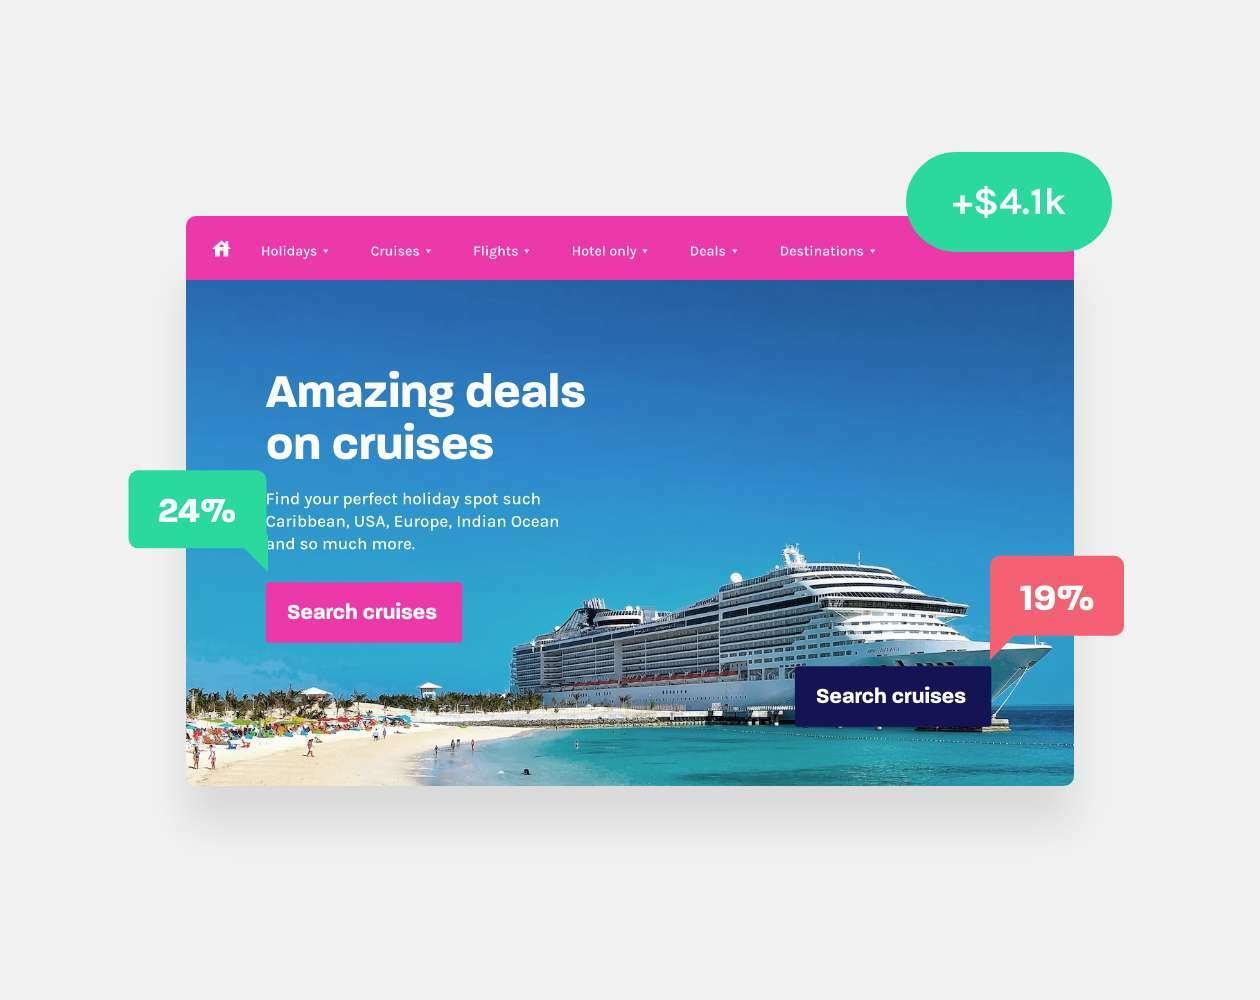
Optimizing your website or mobile app requires a deep understanding of how each page element affects user behavior. With patented tagless capture, Glassbox analyzes 100% of user interactions to reveal patterns of engagement with your site or mobile app. This data helps you resolve user struggles, improve customer satisfaction and optimize the experience to boost revenue and conversions.
See all interactions and key metrics in a single view.
Compare behavior across time, audience segments and A/B test variants.
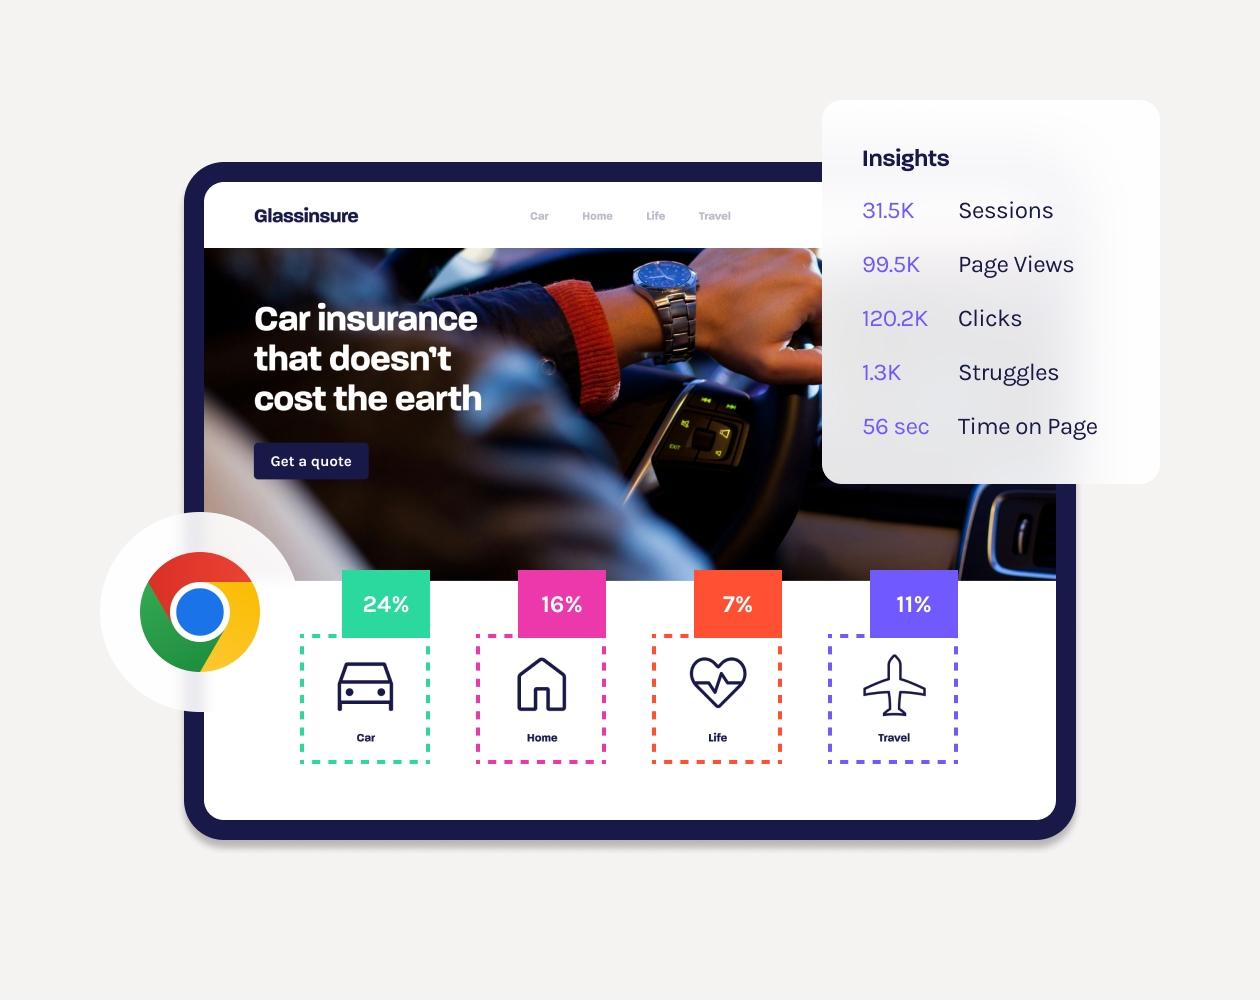
View the interaction map on your live site using the Chrome extension.
Drive revenue with optimized content and layouts
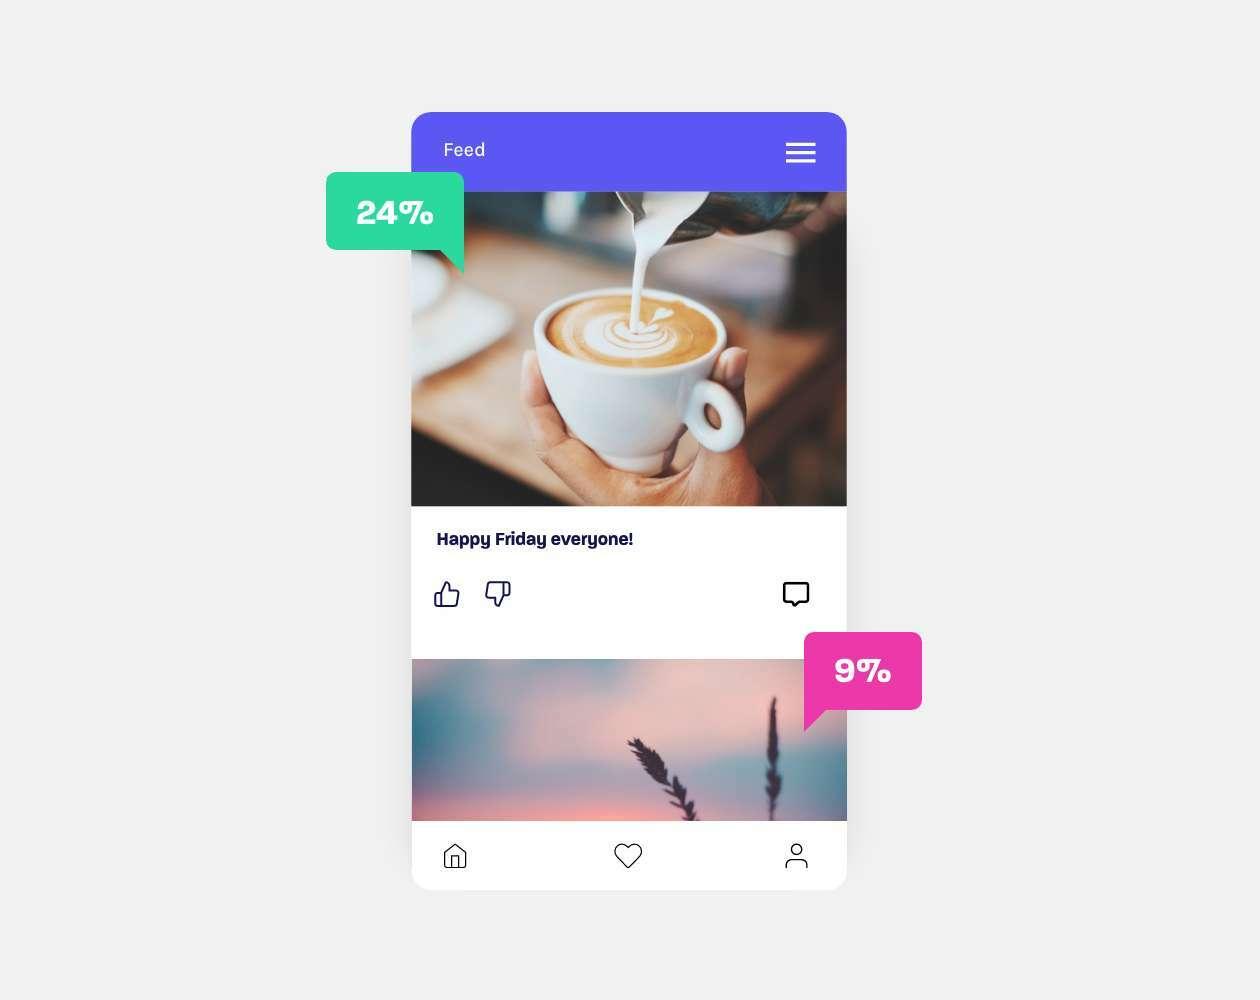
Glassbox reveals opportunities to increase revenue and grow your organization through content optimization. In-page analytics show not only how many users are engaging with page content, but also the revenue impact each element makes along the way.

See your page at every iteration
Using the interaction map in the Glassbox console or Chrome extension, easily switch views to see how users interact with your site at every touchpoint. Understand how different site versions—such as for signed-in users or open menu bars—impact engagement.
Make informed investments
How customers engage with content is not only about placement—quality also plays a key role. Users will often skip or ignore content that doesn’t appeal to them. With Glassbox’s in-page analytics, you can clearly see the kinds of content your customers engage with most, allowing you to make informed decisions about what content to produce in future and how resources are allocated.
Real-time analysis directly on your website
The Glassbox Interaction Map Chrome Extension lets you see real-time user interaction data for every page configuration directly on your live site. Track how elements like menus and pop-ups affect engagement and user behavior and use this data to optimize content strategies, reduce churn and enhance decision-making.

Take a self-guided tour
Take our self-guided tour and experience how Glassbox delivers access to 100% of digital session data for quick analysis of user behavior, performance, and retrospective insights.

Understand how users engage with your content
Interaction maps
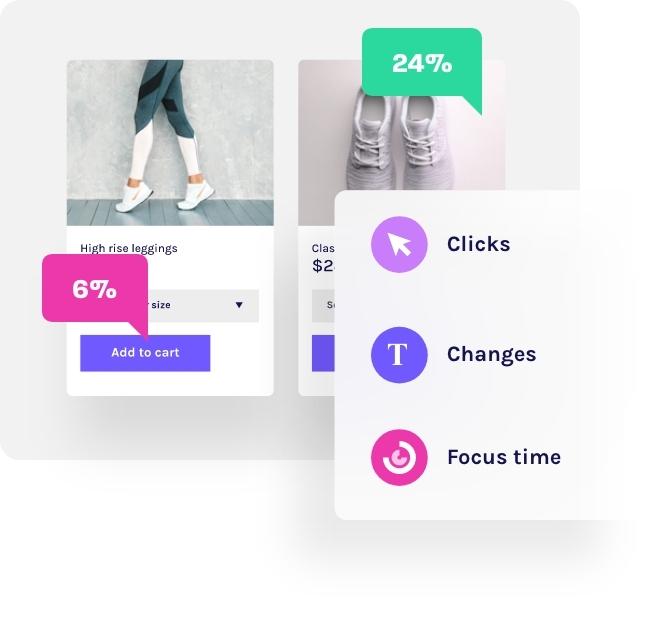
Gain more insight than heatmaps can offer. Our interaction maps present a wide variety of metrics to give you a deeper understanding of how users engage. Visualize click rate, focus time, errors, struggles and their impact on revenue for each element on a page or screen.
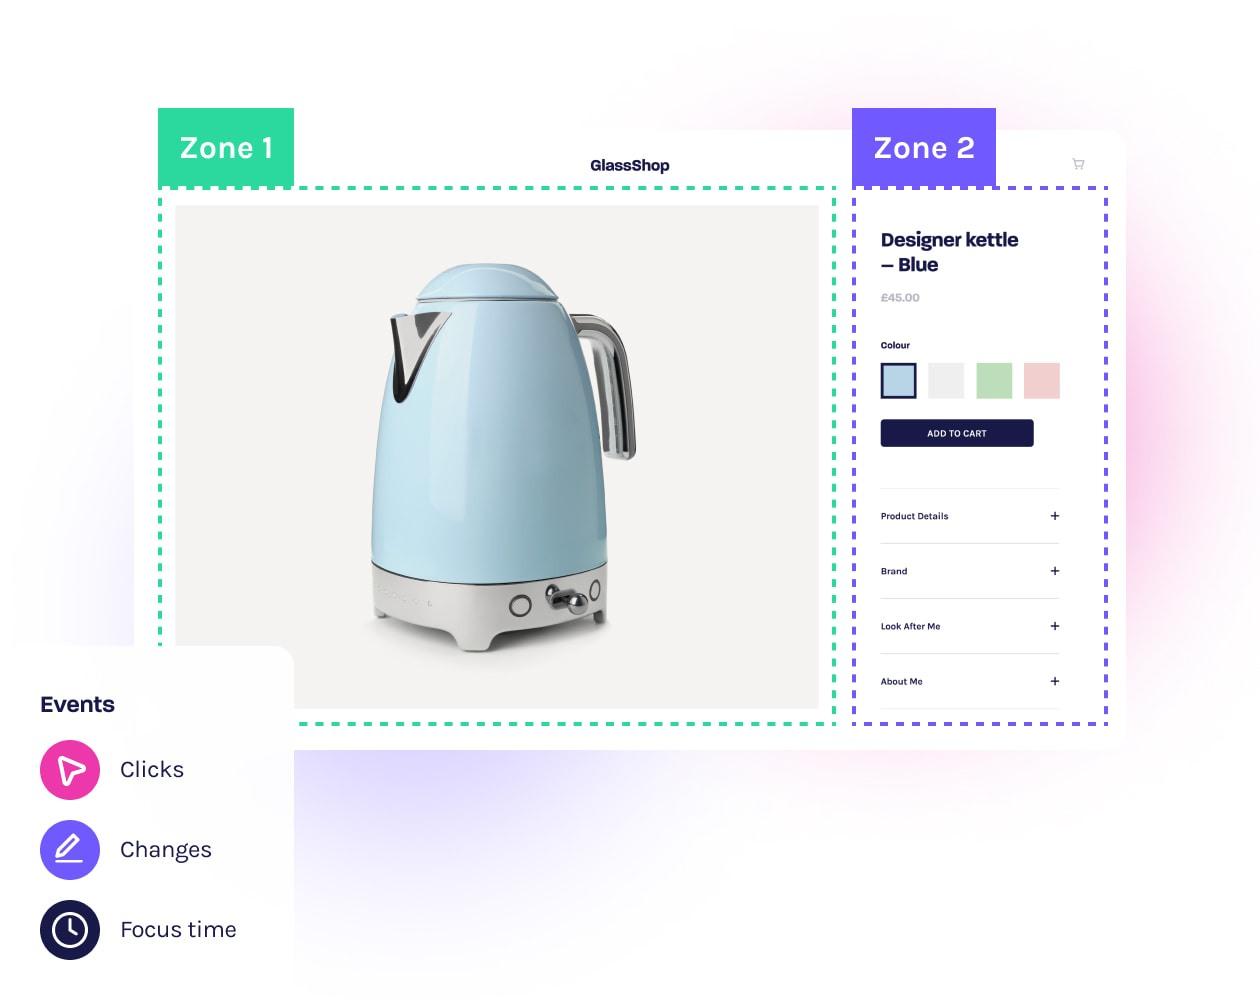
Zone analysis
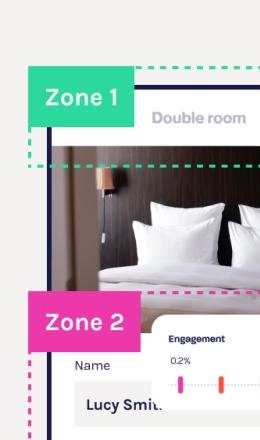
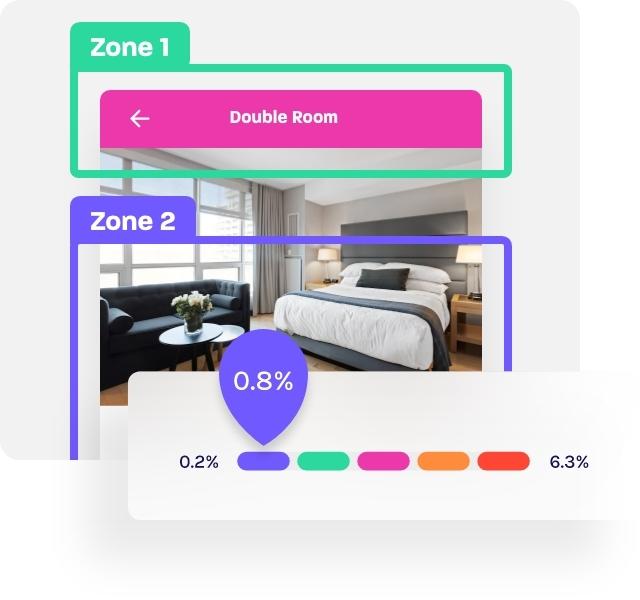
Elements on a screen or page can be grouped into defined zones to provide another way of analyzing how users interact with specific areas of interest. Glassbox makes it simple to see how the zones you define impact the user experience as well as their impact on revenue.

Exposure tracking
Glassbox tracks how far users typically scroll down a page, revealing insights that help you to ensure content doesn’t go overlooked. You can also see what percentage of users clicked an element after viewing it to learn more about what inspires engagement from your audience.

Audience segmentation
Narrow your analysis to certain audience segments with advanced filters.
A/B test analysis
Understand how A/B test variants impact user behavior.
Side-by-side maps
Compare data across segments, tests or time periods side-by-side.Look no further
Get more than what traditional heatmap tools can offer with Glassbox interaction maps.

