Revolutionizing Digital Experiences with Glassbox Interaction Maps
Enhancing Customer Experiences with Real-Time Insights
Executive Summary
Glassbox Interaction Maps redefine how businesses analyze digital customer interactions by providing real-time insights into user behavior. These cutting-edge tools go beyond traditional heatmaps, offering a clear visualization of engagement metrics. By enabling teams to easily identify high-impact areas, optimize layouts and refine content strategies, Interaction Maps help businesses enhance user experiences, reduce churn, and increase conversions.
This whitepaper explores the challenges of understanding user engagement and optimizing digital experiences. It outlines how Interaction Maps empower businesses to uncover actionable insights, analyze dynamic page elements, and make data-driven decisions with ease. We also highlight the role of the Interaction Map Live Chrome Extension, which delivers real-time metrics directly on live websites, streamlining the path to impactful improvements.
Introduction
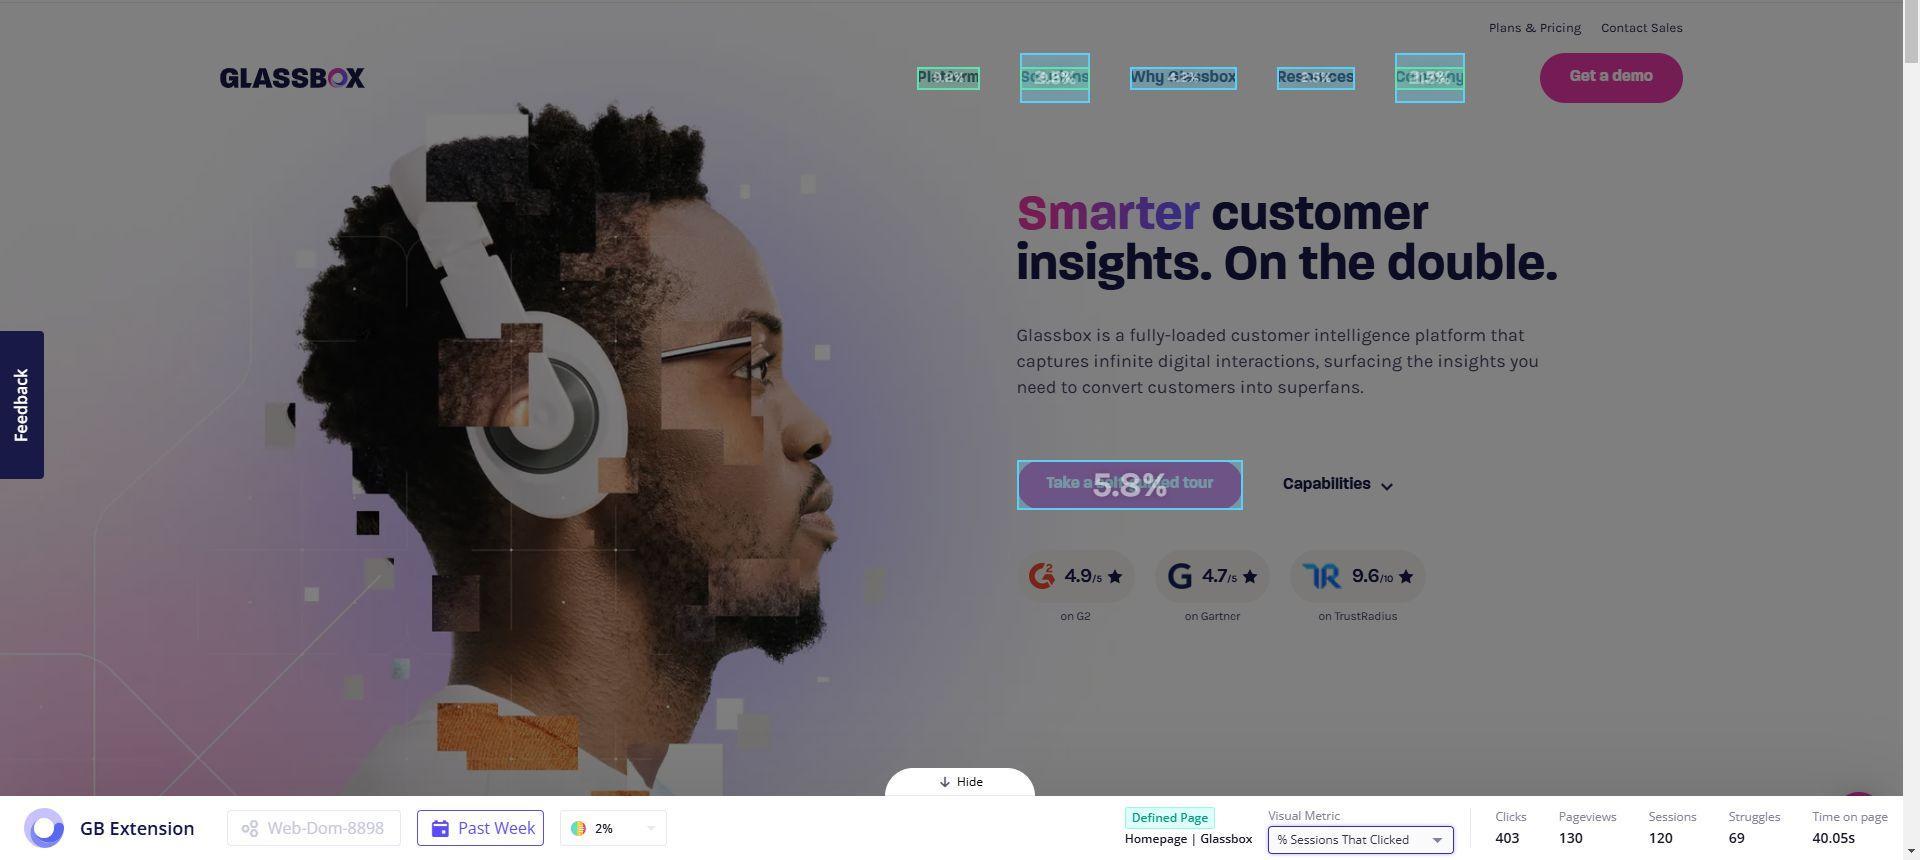
Glassbox Interaction Maps go beyond the limitations of conventional heatmaps, offering deep insights into user behavior by tracking metrics such as time spent on elements, click frequency, areas of struggle and more. When paired with the Chrome Extension, Interaction Maps reveal how user interactions on a particular page of your site or app impact experience, conversions and revenue.
The Problem
Site abandonment and low engagement are often symptoms of deeper issues. Businesses lack visibility into where users are spending time, which areas of a page are being overlooked and where to place critical elements like CAs or popular items. Understanding interactions with dynamic page elements-such as menus, pop-ups or cookie banners-remains a challenge. Without this clarity, delivering engaging customer experiences becomes difficult, leading to user frustration and lost revenue.
The Solution
Glassbox Interaction Maps make it easy to understand and optimize user engagement by providing a clear visualization of on-page behavior. Businesses can track where users spend time, how they interact with elements and which areas are being overlooked. With insights into clicks, focus time and struggles, teams can quickly identify opportunities to improve layouts, enhance content placement and reduce friction.
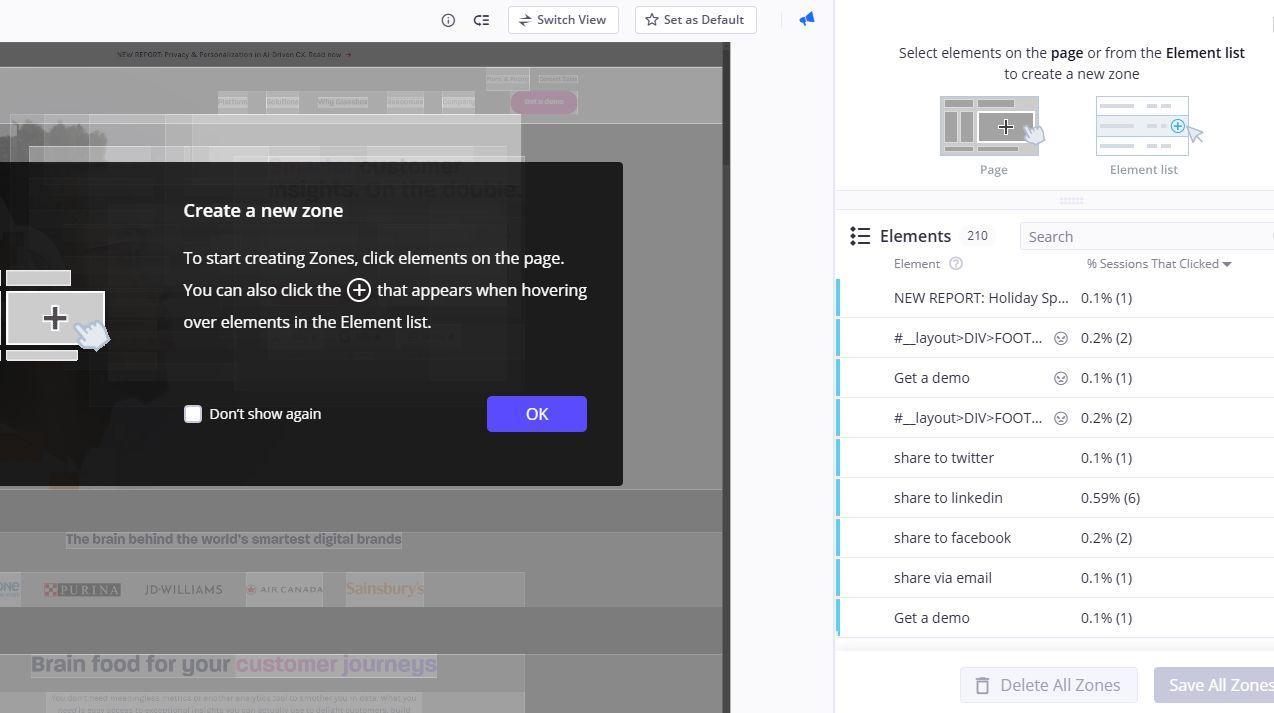
With Interaction Maps, businesses can group elements or define custom zones for focused analysis and compare interactions across time, audience segments and A/B test variations. In-page analytics reveal both user engagement and the revenue impact of each element, empowering teams to make data-driven decisions that improve satisfaction and drive growth.

Key features
- Real-Time Analysis
View user interaction metrics directly on your live website using the Glassbox Interaction Map Live Chrome Extension-no need to toggle between tools.
- Custom Zone Analysis
Group elements into self-defined zones to analyze user interactions within specific areas of interest and save these zones for ongoing monitoring.
- Comprehensive Interaction Metrics
Visualize click rates, focus time, errors and struggles for every element on a page or screen, helping to identify high-engagement areas and problematic elements.
- Exposure Tracking
Measure how far users scroll on a page and compare the percentage of users viewing an element to those clicking it, providing insights into engagement and content visibility.
- Dynamic Page Views
Easily switch between different page states, such as when a cookie pop-up appears, menus are opened or users are signed in, to analyze how these variations impact user engagement and behavior.
Use Cases and Applications
Boosting Engagement in Finance
Financial organizations with online dashboards can leverage Interaction Maps to analyze how users interact with key elements like account balances, payment options or transaction histories. By grouping these elements into zones, teams can monitor user focus areas and identify underutilized features. For example, if users aren't interacting with the payment option zone, the organization can redesign the page to make this section more prominent, improving satisfaction and retention.
Improving CTA Placement in E-Commerce
E-commerce businesses can use Interaction Maps to identify why users spend significant time on product pages without completing a purchase. For instance, a retailer may discover that users frequently interact with the product description but fail to notice the "Add to Cart" button located near the bottom of the page By visualizing these interactions and tracking exposure, the business can reposition the button higher on the page or make it more prominent, reducing cart abandonment and increasing conversions.
Optimizing Content Placement in Travel Websites
Travel companies can use Interaction Maps to understand how dynamic page elements-such as cookie pop-ups or promotional banners-impact engagement. For instance, a travel site may find that users close a pop-up offering a discount without engaging or providing their email address. By visualizing interactions across page states, such as when menus are opened or pop-ups are displayed, the business can reposition the offer to a more visible and less intrusive area, increasing engagement and boosting conversions.

Customer Success Story
A product owner at a financial services company used Glassbox Interaction Maps to analyze two homepage designs in an A/B test. Interaction Maps revealed that users were more likely to click on the "Apply Now" button in Variant B than the "Get Your Money" button in Variant A. The team then used funnel analysis to confirm that Variant B drove a 1.3% higher conversion rate. These insights empowered the team to choose the better-performing design, increasing engagement and conversions confidently.
Implementation and Integration
Interaction Maps are included in the Glassbox CX Essentials plan, which provides businesses with a comprehensive suite of tools to optimize digital experiences. This plan includes essential features like session replay, mobile analytics, struggle scores, error reports and more, enabling teams to uncover user behavior patterns, address pain points, and enhance satisfaction across channels.
The Interaction Map Live Extension is easily deployed via the Chrome Web Store and requires minimal setup. Once installed, it integrates seamlessly with the Glassbox console, delivering a unified experience for data analysis. With the extension, teams can view real-time user interaction metrics directly on live websites, making it simple to analyze page elements and their impact-no need to switch between tools.


